By: Corinne Singeisen, PhD Student, Theme 1 - Landslide severity
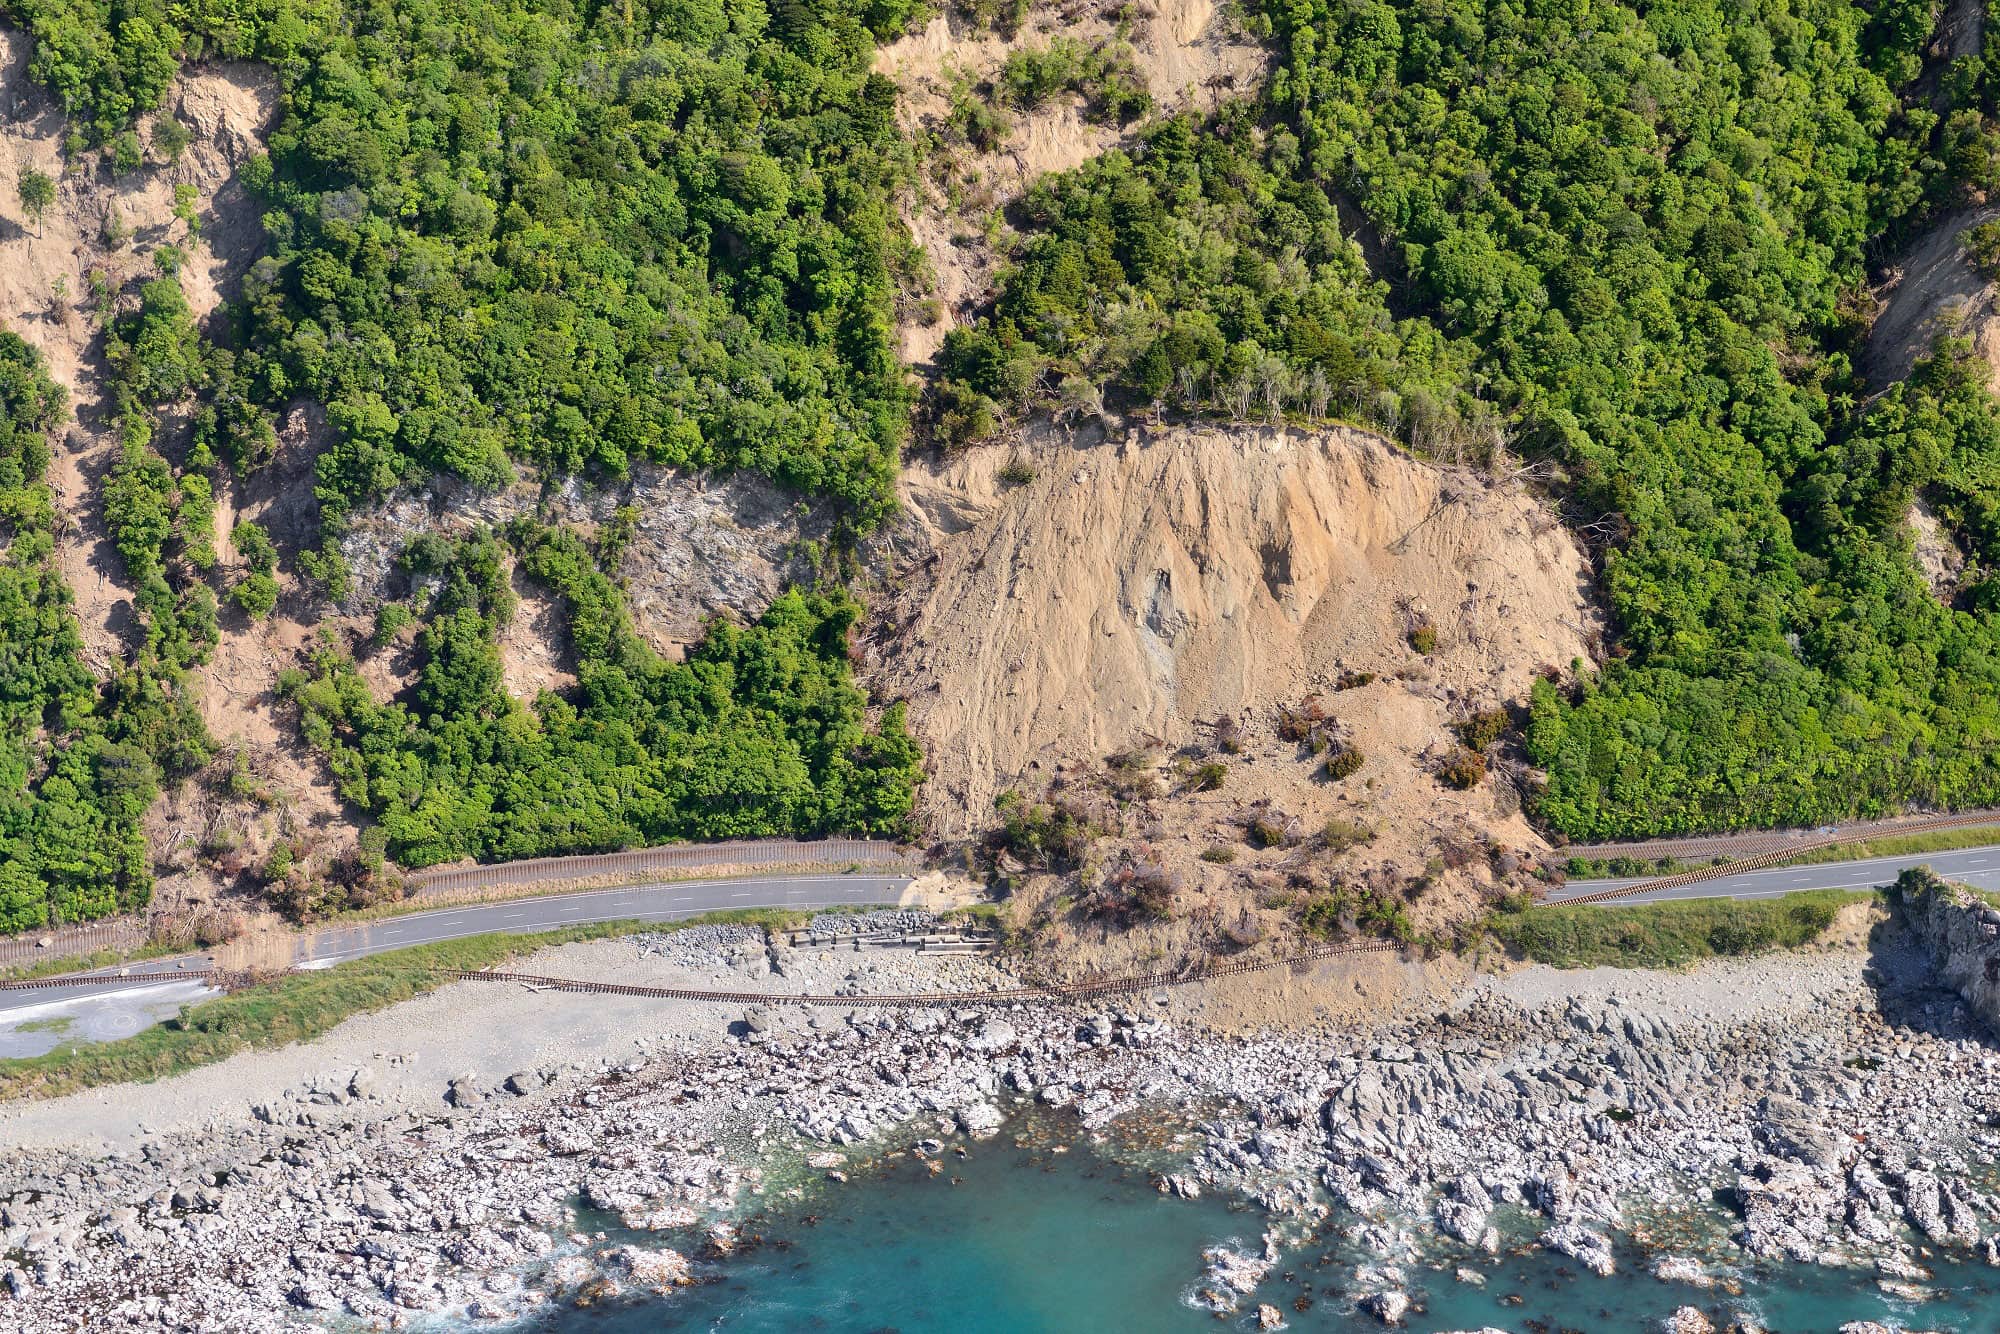
In November 2020 and January 2021 a team from GNS Science, University of Canterbury, and University of Auckland spent several weeks in the field collecting data from landslides triggered by the 2016 Mw 7.8 Kaikōura earthquake. Our goal was to get a better understanding of how and why these landslides failed during the 2016 earthquake. This understanding will ultimately help us to identify slopes that might become unstable or fail in future earthquakes.
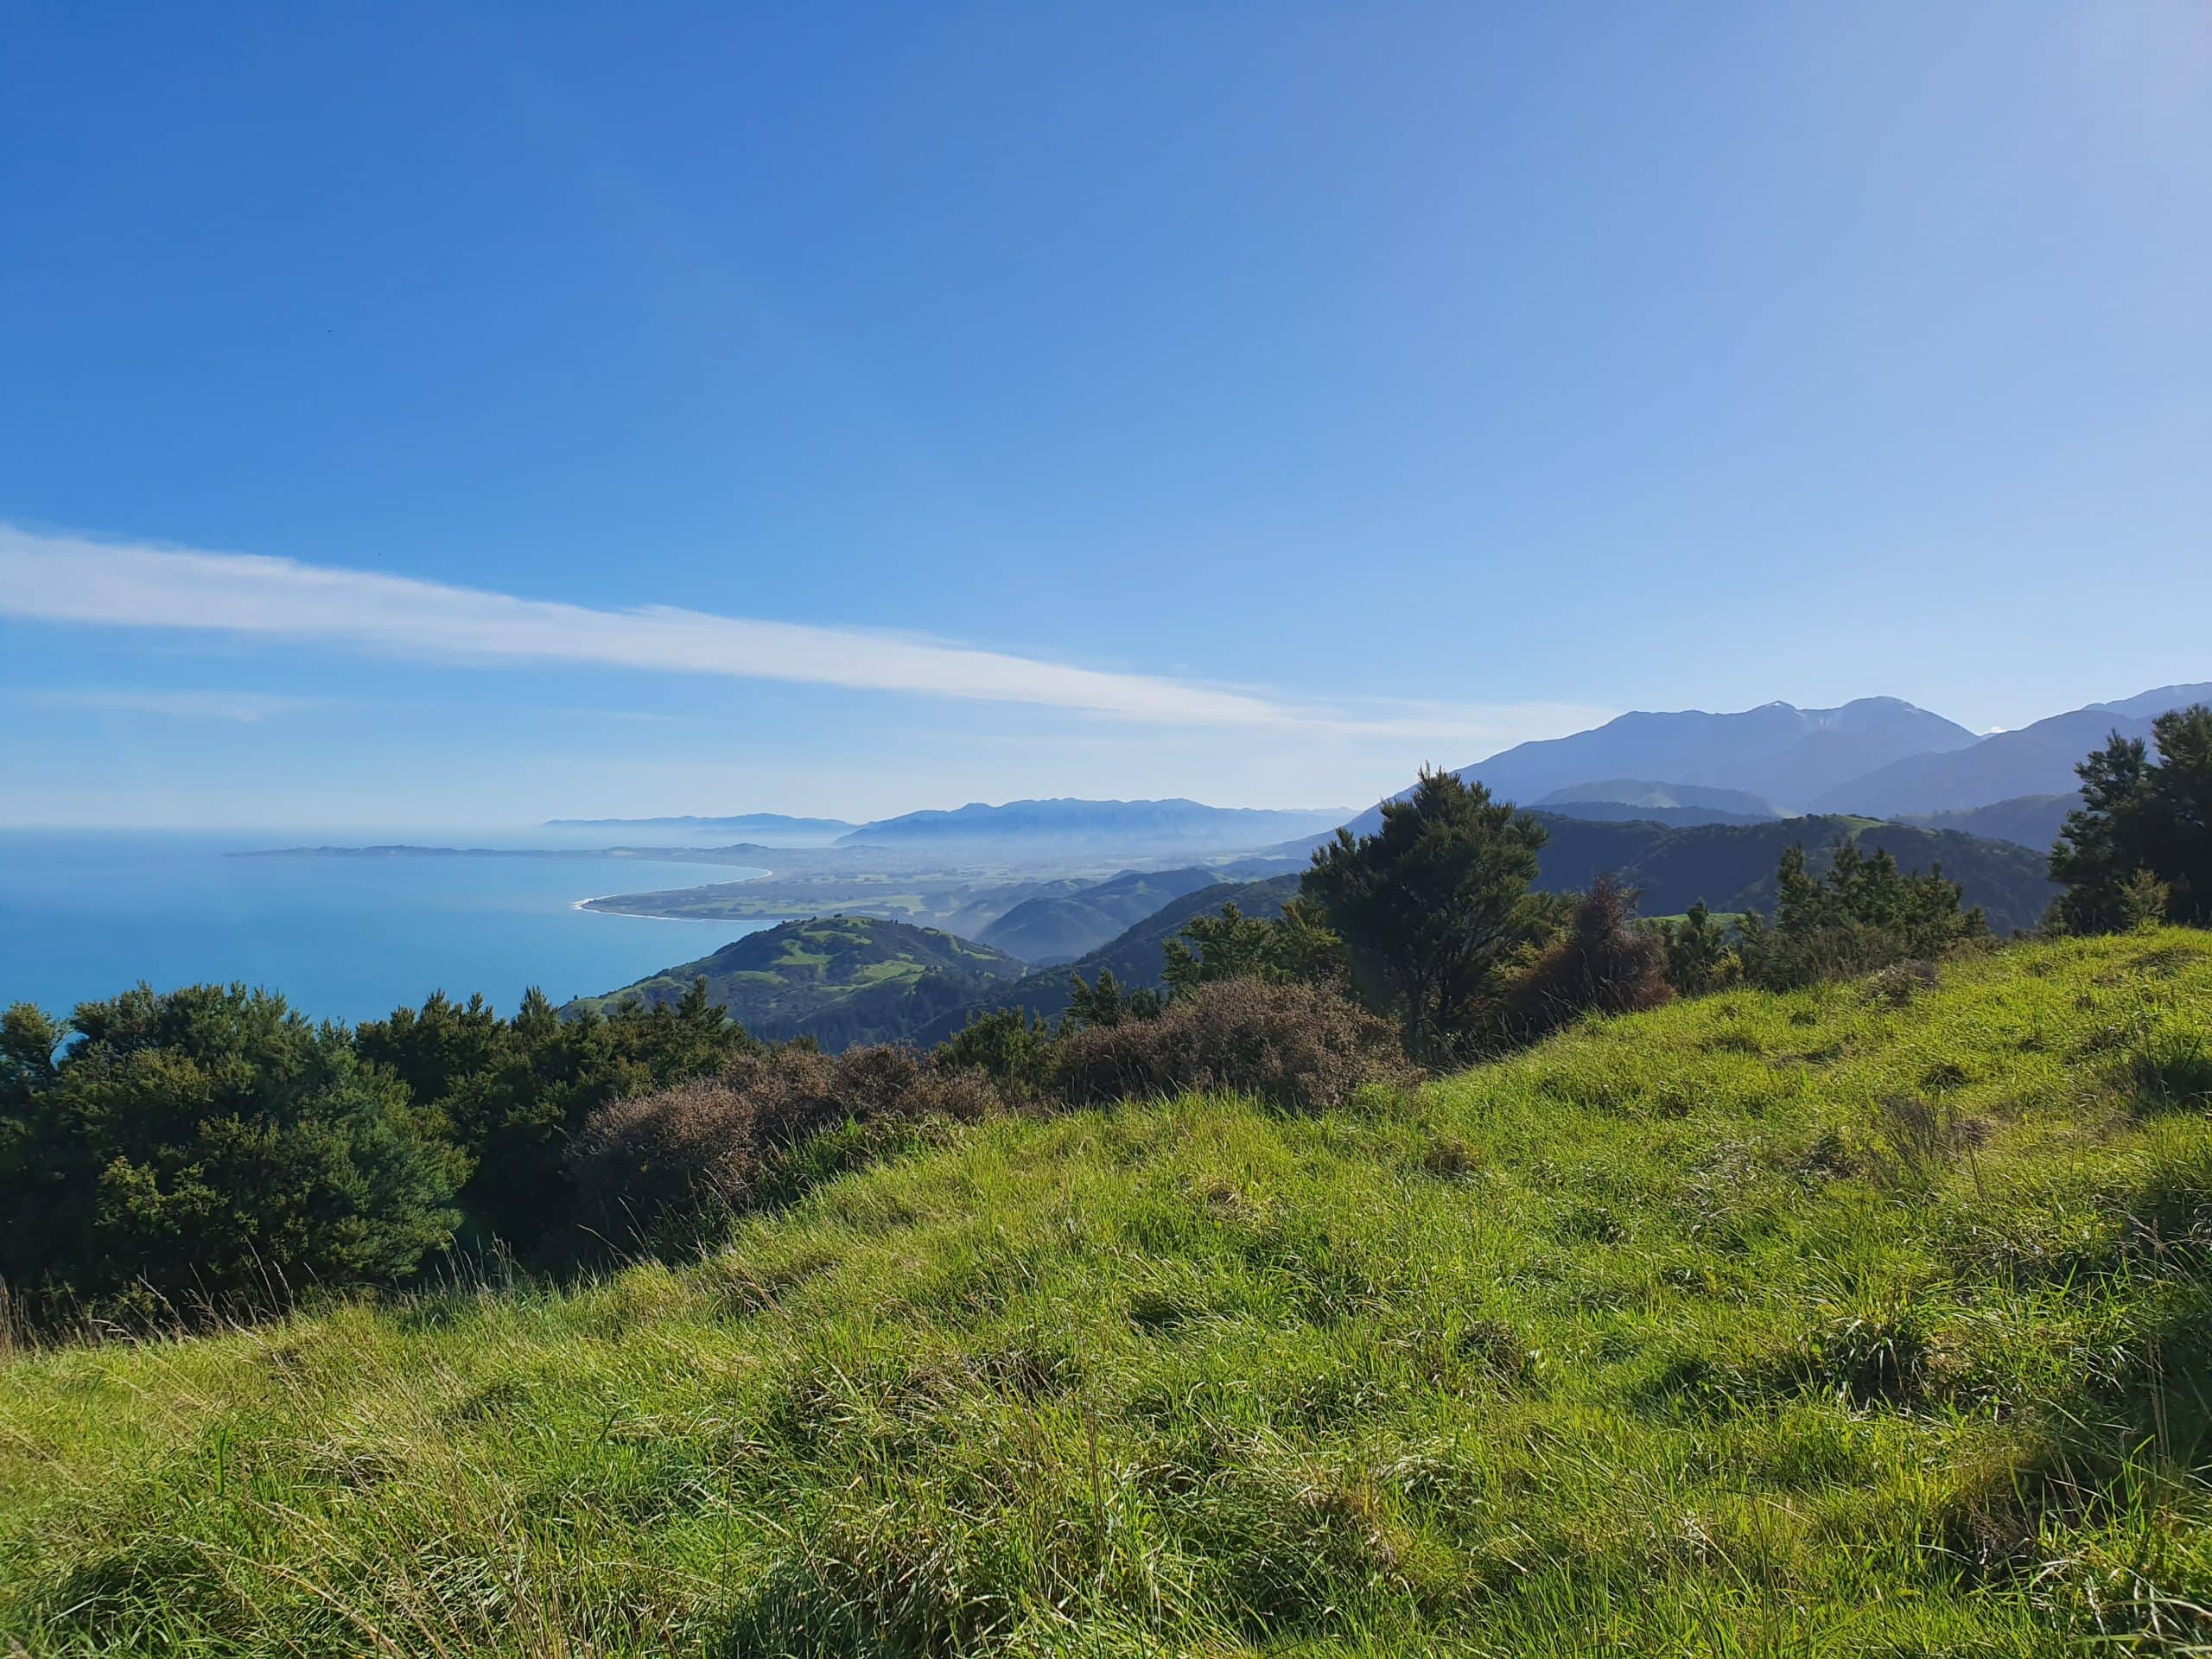
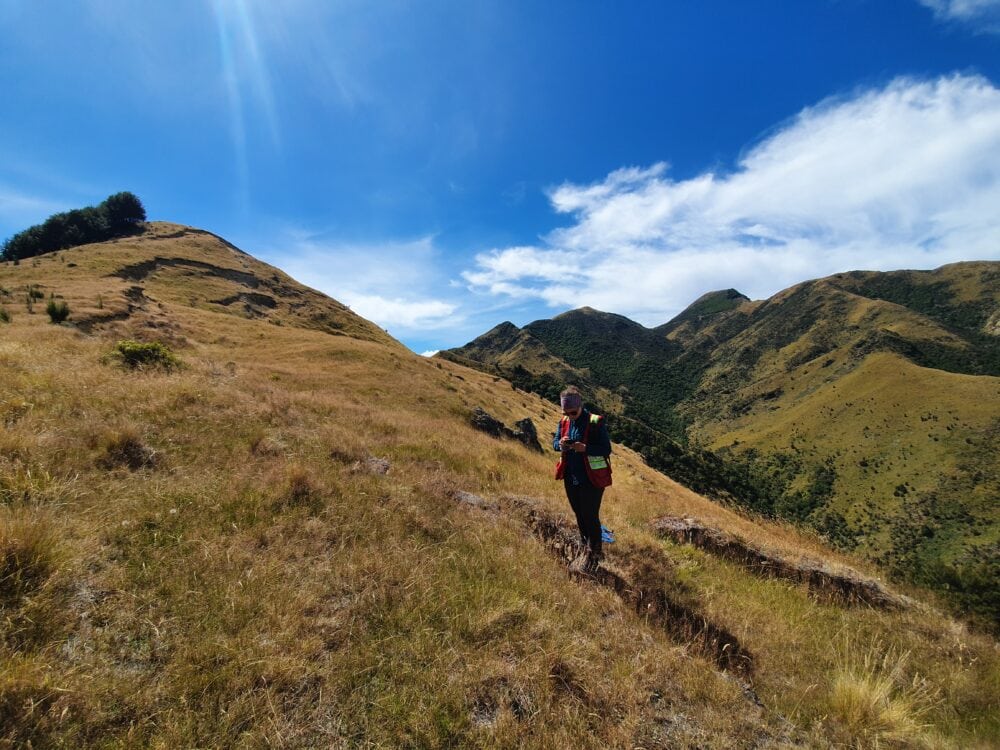
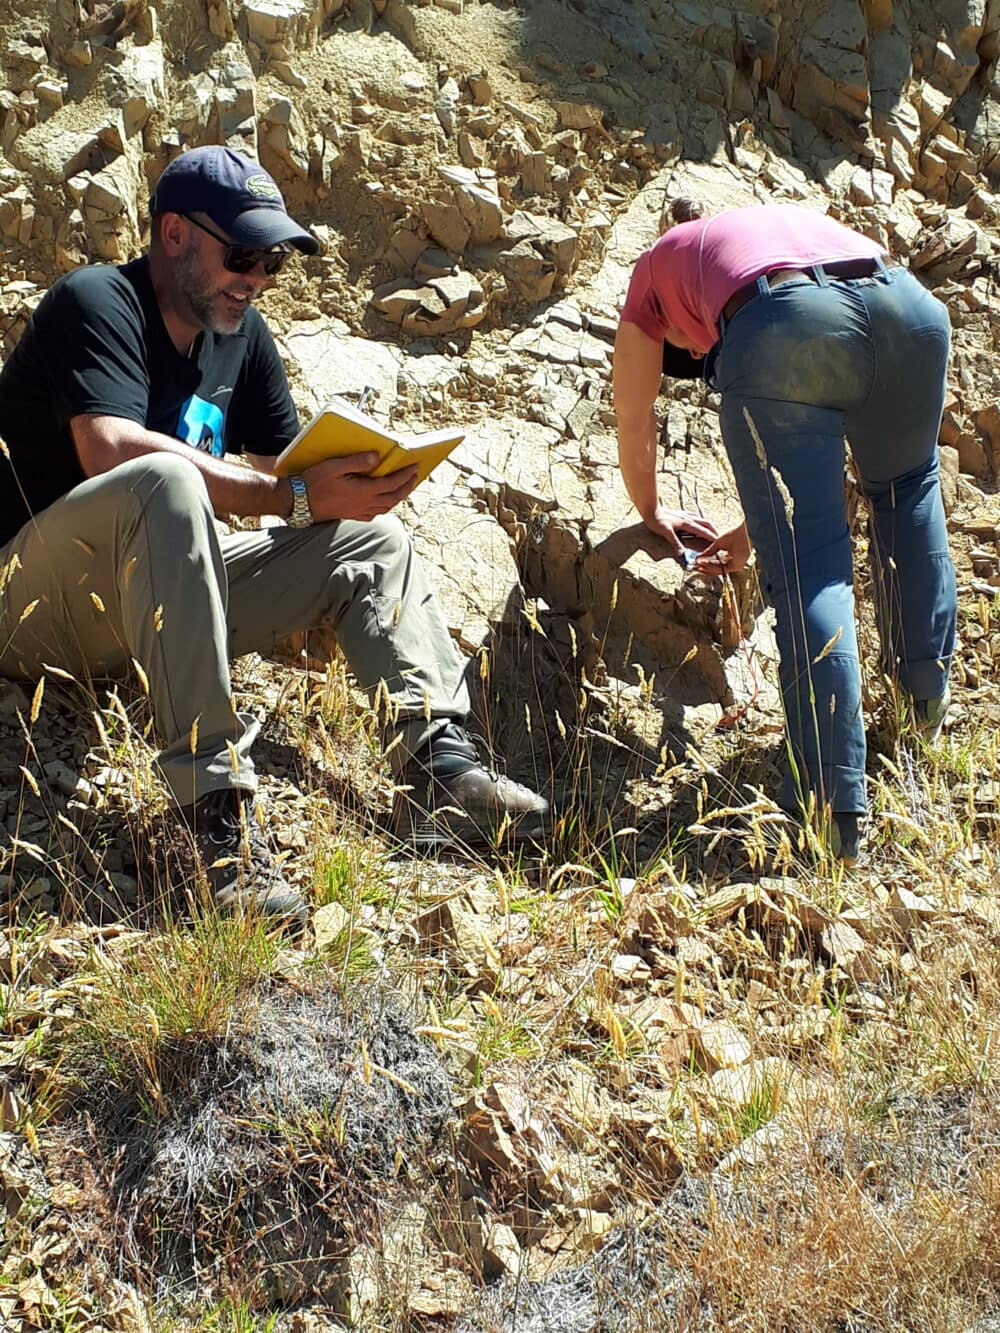
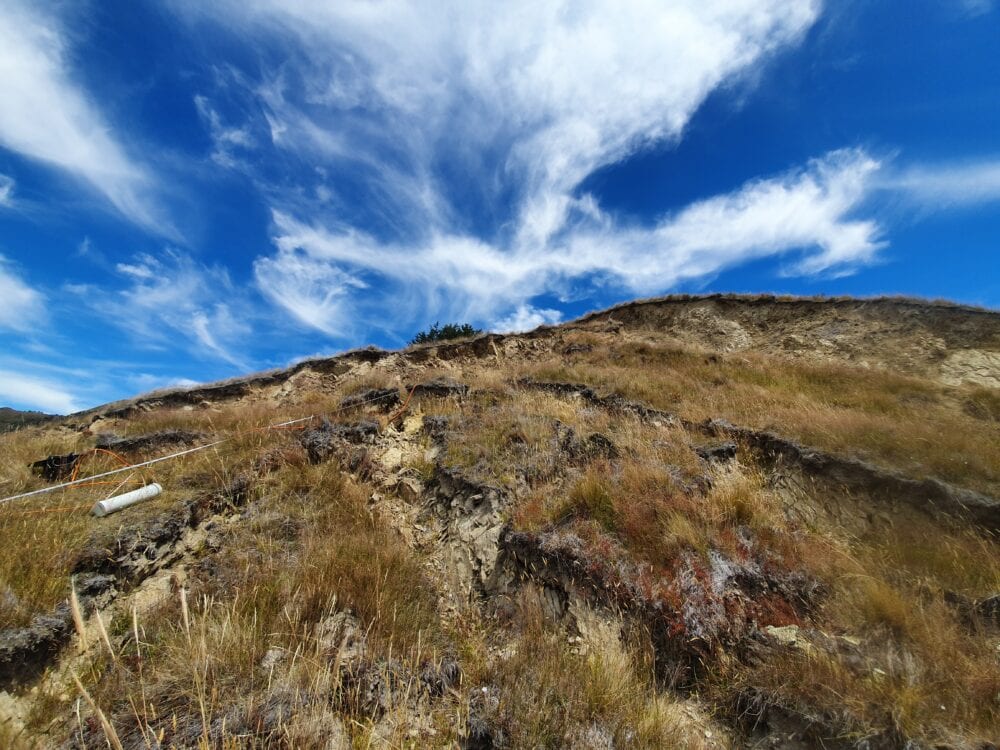
The main research question of my PhD is: What factors control the initiation of coseismic landslides? Collecting as much field information as possible from a variety of landslide sites gives us the necessary data to tackle this question. We chose several landslide sites in North Canterbury and along the coast North of Kaikōura to investigate. At each site we mapped the geology and geomorphology and collected geophysical data. Lucky for us, our long days of hard work in the field were rewarded by stunning views!
Geologic mapping around a landslide allows us to identify the material types and structures in which the landslide failed. To understand how the landslide initiated, we need to know what the bedrock was like before the landslide occurred. On the other hand, mapping ground cracks, scarps, and other geomorphic features allows us to characterise how the ground deformed during the earthquake before portions of the slope rushed down as debris or rock avalanches. This helps to identify slopes that could be close to failure. Geophysical data brings together our mapping and provides a full picture of the landslide revealing how the rock properties vary in the subsurface and the depth to which the landslide extends
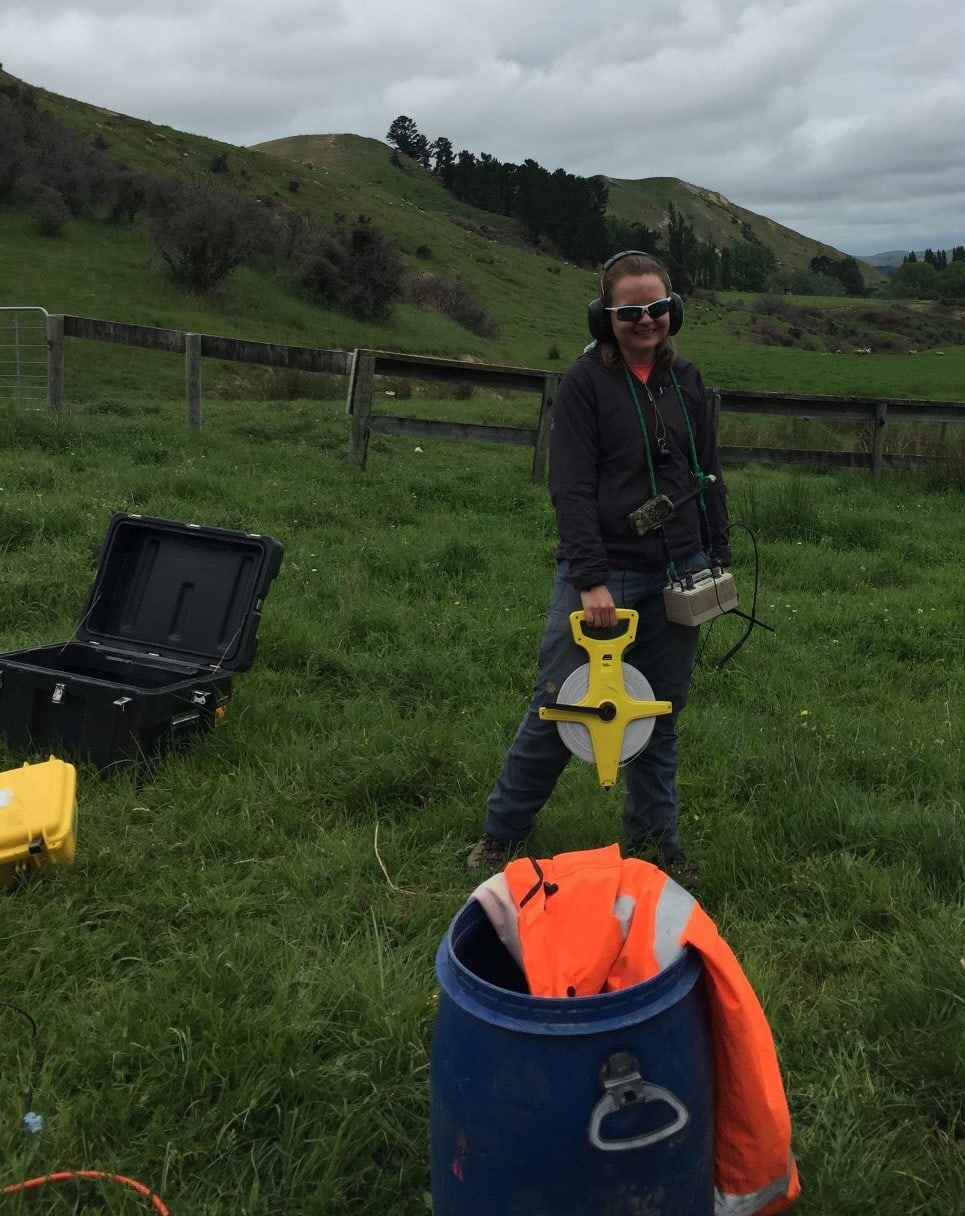
We conducted electrical resistivity surveys, one form of geophysics, to give us a subsurface profile image of the conductivity in the ground which can be used to identify areas that are fractured and saturated with water. We also conducted seismic surveys to create an image of seismic velocities with depth. This information tells us about the rock type, amount of fracturing in the rock, and gives us some indication of how deep the landslide extends. The surveys provide amazing data but that data is hard earned. Each survey requires laying out hundreds of meters of cable over steep, broken up terrain, hammering in electrodes and geophones all along the cable and, in the case of the seismic surveys, slamming a very large sledgehammer into a metal plate a few hundred times! This was a big effort and I am very grateful for the hard work of everyone involved!
Using all the information we gathered in the field and information about earthquake shaking in 2016, I will set up a computer simulation for each landslide. These models will help to identify the factors that most influence the initiation of the landslides. Bringing this work together with other remote sensing and numerical analyses from my PhD I hope to provide some valuable new insights into what factors control the initiation of coseismic landslides. As the initiation of coseismic landslides is the root cause of post-earthquake landscape dynamics the outcomes of my project links to the overall objectives of the research programme to effectively manage earthquake- and post-earthquake landslide risk and I am very much looking forward to integrating my work into the broader context of earthquake-induced landslides and landscape dynamics.
Head Office
1 Fairway Drive,
Avalon 5010
PO Box 30-368,
Lower Hutt 5040
New Zealand